Canada’s Inflation Prints and Interest Rate Hikes
Unraveling Canada's inflation prints and looking at the year-over-year base effects
Hey everyone, welcome back to another edition of the 5i Research newsletter. In this post, we are going to take a look at the latest Canadian inflation print of 4.4% and what we might expect going forward.
Let's dive in!
There has been significant concern and uncertainty surrounding Canada's recent inflation print of 4.4% and the Bank of Canada's decision to continue hiking interest rates. However, a closer examination of the factors driving Canada's inflation and a projection of future trends can provide a clearer perspective on the situation.
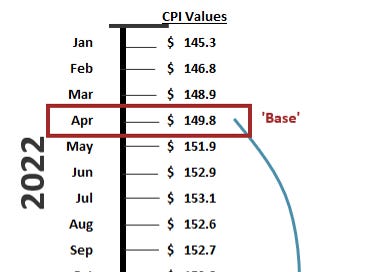
Inflation is calculated as a year-over-year reading, where the current year's value is divided by the previous year's value. The base, or denominator, of this division equation, determines whether the inflation reading will be high or low. A high base implies a low inflation reading, while a low base suggests a high inflation reading. For example, the April 2023 inflation rate of 4.4% was calculated by dividing the April 2023 Consumer Price Index (CPI) value of $156.4 by the April 2022 value of $149.8.
A ‘High’ or ‘Low’ Base
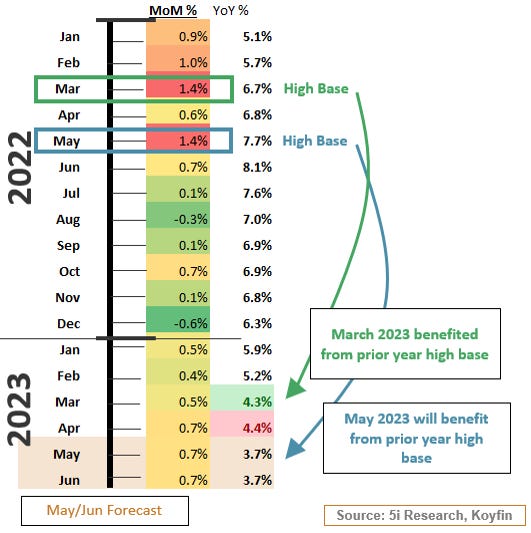
To determine if the prior year's base is high or low, we can analyze the month-over-month percentage changes in inflation. A high month-over-month percentage change indicates a high base, and vice versa. By examining the data, we find that the months of March and May 2022 had high bases, resulting in relatively low inflation readings for March and May 2023. Based on this analysis, we can forecast a 0.7% monthly change in CPI for May and June 2023, leading to projected headline CPI readings of 3.7% for each month.
The interplay between high and low bases explains the recent spike in inflation to 4.4% in April. The low base of April 2022 compared to the high reading from March 2022 contributed to this increase. Consequently, we can anticipate a relatively low inflation reading for May 2023 due to the high base from the previous year, followed by a relatively high CPI print for June 2023 due to the low base of June 2022.
Breaking Down the Inflation Story
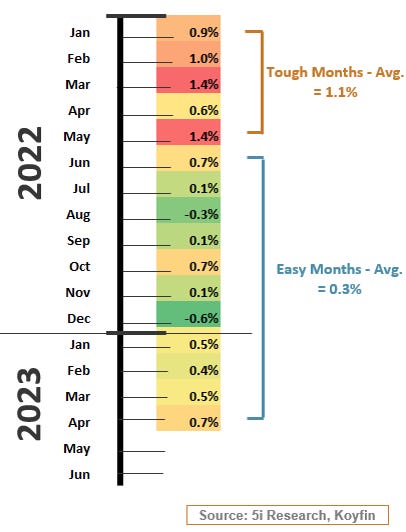
Analyzing the inflation story from 2022 to 2023, we can identify two main components: the challenging months from January to May 2022 and the relatively easier months from June 2022 onwards. The tough months experienced abnormally high stints of inflation, with an average month-over-month change of 1.1%. In contrast, the easy months had an average month-over-month change of 0.3%, aligning with a more "normal" annualized rate.
Modeling Future Inflation Scenarios
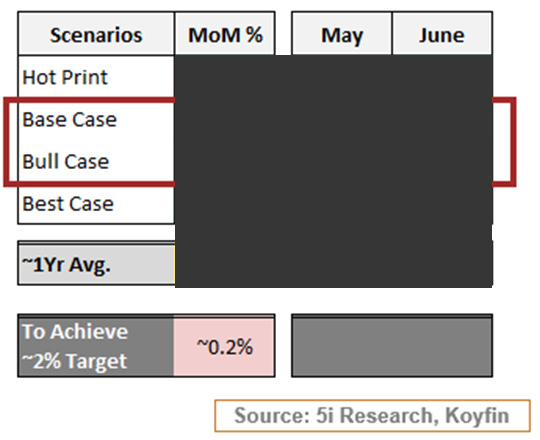
Using the average month-over-month change of 0.3% observed over the past year, we have modeled future inflation scenarios. For full access to the modeled scenarios for the May and June inflation print, check out our free 14-day trial to receive full access to market updates like this and more.
For more content like this, head to 5i Research or check out the free 14-day trial above.


