Hey everyone, welcome back to another edition of the 5i Research newsletter. In this post, we are going to go over some of our favourite charts from our latest quarterly Chart Attack report at 5i Research.
Let’s dive in!
Consumer Confidence - Canada
Canadian consumer confidence measures the personal financial situation and forward six-month financial situation of Canadian consumers as it relates to household or other purchases, job security, ability to invest, and others. The consumer confidence index has recently hit a low that was last seen in 2020 and 2016. It is not yet clear if this is the bottom of the consumer confidence index, although it is at a level that has only occurred twice before in the past 10 years. An eventual return in consumer confidence would signal positive developments for the economy and financial markets.
IVEY PMI - Canada
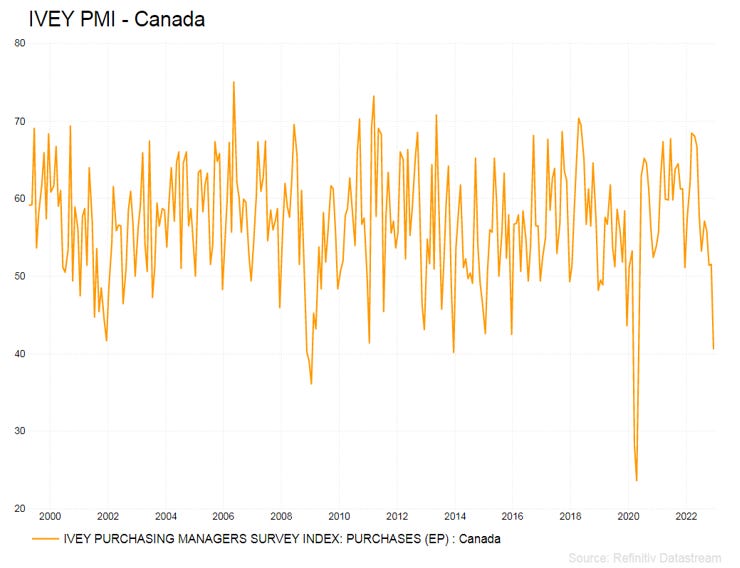
The Ivey PMI is an abbreviation of the Ivey Purchasing Managers Index. The index indicates whether purchasing managers see the manufacturing and services sectors as expanding or contracting. It is often seen as a leading indicator of the future direction of the broader economy since purchase orders by manufacturers lead consumer activity. Generally, a reading above 50 is seen as leading economic expansion and below 50 is economic contraction. Recently, the PMI index has been decreasing and is close to reaching a level that has historically acted as support over the past two decades.
A 5i Research Membership offers you many tools and information to help in your investment journey, including growth stock ideas, exclusive research reports, a database of over 100,000 questions answered, portfolio tracking, watchlists, customizable alerts, and access to a team of experts to help you along the way.
Start your free trial today!
TSX 300 - Average P/E, Current P/E and Annual Range
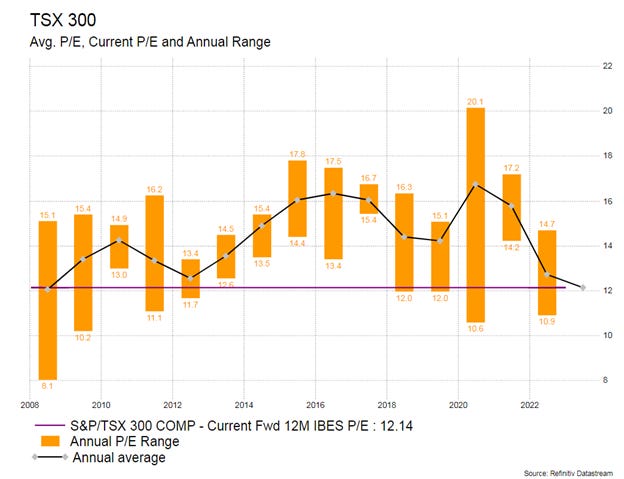
This chart is known as a ‘floating bar chart’. Each bar represents the high and low range that the TSX P/E fluctuated between for each respective year. The black line outlines the annual average P/E for each year. There are a few interesting items to note about this graph – the first is that certain years can be seen to have a smaller bar than other years, indicating that the TSX traded in a tight P/E range for that year. The second item is that the average P/E has fluctuated over the years, hitting a high of ~17X P/E and a low of ~12X P/E. The current forward P/E for the TSX is 12.1X, which is similar to levels last seen in 2008. Whether this represents a bottom in market valuations is unclear, but we are nearing levels of support for valuations.
Enjoying the report so far? Grab your favorite drink, download our exclusive report, and enjoy. It includes hard-to-find charts on equities, the economy, and the real estate market. Download for FREE below!


