Cracks Emerging in the Housing Inflation Component?
Decreasing home prices and rents act as tailwinds for US inflation
Hey everyone, welcome back to another edition of the 5i Research newsletter. In this post, we are going to go through part of a deep-dive analysis of the shelter component for US inflation.
Let’s dive in!
Inflation and Housing
Housing (shelter) is a sizeable component of the Consumer Price Index (CPI) and over the past year has been a big contributor to keeping inflation elevated. This is particularly true for the Federal Reserve’s preferred measure of inflation - core CPI. Shelter makes up about one-third of the entire US CPI, and just under half (40%) of core CPI.
This makes the housing component a large determining factor in where we can expect inflation to go, and small increases/decreases in shelter can have big knock-on effects to CPI.
US CPI Shelter Component Chain of Events
The shelter component in the CPI is largely made up of rent and Owners’ Equivalent Rent (OER). The rent component uses the actual rent amounts paid for one’s primary residence. OER, on the other hand, is used to determine the cost that a homeowner would need to pay if they were renting their homes. OER is derived from the average rents paid for comparable rental housing within the same area for owned houses. This means that both major pieces of the shelter component (rents and OER) are in fact driven by the same factor, rents.
From our analysis, we have determined that the chain of events determining the shelter CPI component is as follows.
A Lag in Housing Data
While the above diagram seems logical, to back up our thesis, we have analyzed the year-over-year change in US home prices, rents (as determined by the Zillow rent index), and the rents and OER CPI components. The trend that we noticed is that there is a lag between house prices accelerating and cooling and the actual rents paid, and then a further lag between rents paid and the shelter inflation data (rents and OER).
In the timeline below, we can see that home prices lead rental rates (Zillow rent index) by about 1-4 months, and rental rates lead CPI housing data by about 6-12 months.
It is also interesting to note that house prices and rents began cooling in mid-2022, whereas we are just now beginning to see a stagnation in the year-over-year CPI shelter data. This leads us to believe that there is the potential for significant tailwinds in US inflation as lagged and cooling house and rent data will be reflected in the CPI data over the course of the next 6-12 months.
A 5i Research Membership offers you many tools and information to help in your investment journey, including growth stock ideas, exclusive research reports, a database of over 100,000 questions answered, and more.
Start your free trial today!
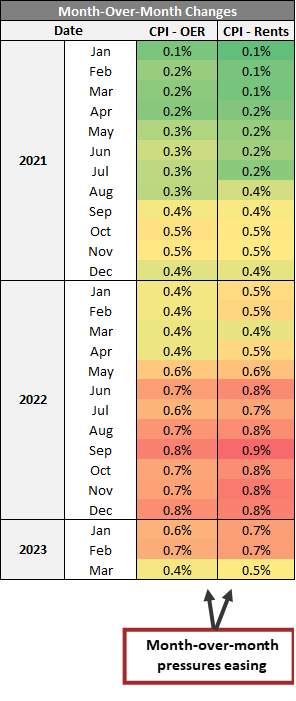
Month-Over-Month Shelter is Easing
Not only are we beginning to see a stalling in the year-over-year shelter data, but we have also just witnessed a deceleration in the month-over-month shelter data.
The recent CPI data that was released this past week for March shows the slowest month-over-month increase in shelter since April 2022.
Could this be the beginning of a break in the sticky housing inflation component?
Source: 5i Research, bls.gov/cpi
Enjoying the report so far? Check out our services at 5i Research with the below free 14-day trial to get full access to more content like this.


