


Unveiling Opportunities in Small and Mid-Cap Stocks
With mega-cap stocks popping higher, is now the time to buy mega-caps? I see an opportunity in small and mid-cap stocks

Hey everyone, welcome back to another edition of the 5i Research newsletter. In this post, we are going to take a look at the current opportunities within the small and mid-cap space.
Let's dive in!
Ebb and Flow of Market Returns
Examining the trailing 12-month returns since 1988, we observe a parallel movement between large-caps (LC), mid-caps (MC), and small-caps (SC). This indicates a correlation in their performance, making it logical that if an investor is bullish on large-caps, it also makes sense to be bullish on small and mid-cap stocks.

Seizing Opportunities in Market Downturns
By examining the Russell 2000 index since 1988, we identify areas of significant declines (20% or more), which have historically provided attractive buying opportunities. These drawdowns occur infrequently and are often followed by market recoveries, making them historically ideal entry points for investors. In 2022, we saw the Russell 2000, a small-cap index, decline as much as 30% to 35% on a trailing-12-month basis.

A 5i Research Membership offers you many tools and information to help in your investment journey, including growth stock ideas, exclusive research reports, a database of over 100,000 questions answered, portfolio tracking, watchlists, customizable alerts, and access to a team of experts to help you along the way.
Start your free trial today!
Relative Strength Index (RSI) Model
Using the RSI indicator, we analyze the momentum of the Russell 2000 index. Green dots, representing periods of negative momentum, have historically indicated favorable buying opportunities. Currently, with an RSI below 45, the RSI model suggests a good buying opportunity for small-cap stocks.
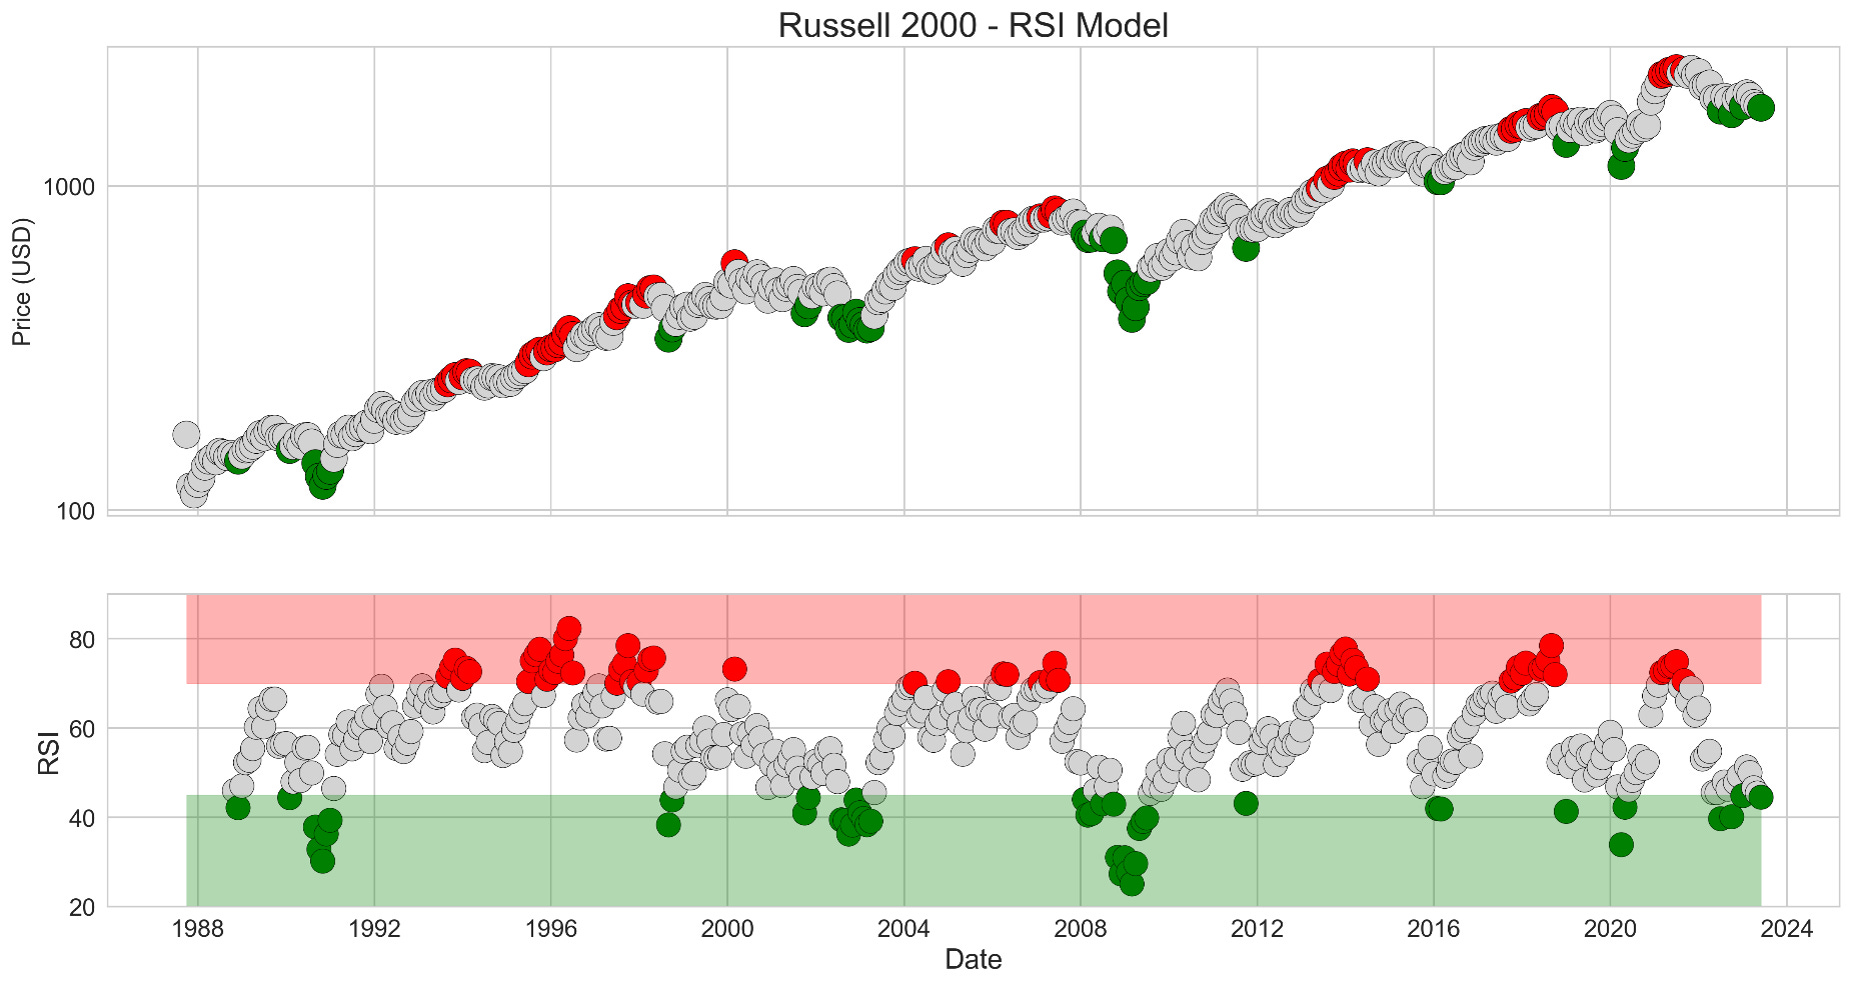
Source: 5i Research, YahooFinance
Analyzing Past and Future Returns in the Russell 2000
The scatter plot presented here provides a comprehensive view of the Russell 2000's performance, analyzing its 1-year past and forward trailing 12-month returns since 1988. This chart illustrates the relationship between prior-year declines or gains (from left to right) and forward 1-year declines or gains (from bottom to top). Forward returns are skewed to the upside when prior year returns were negative. Investors do not get outsized returns when the market is doing great, outsized returns come from large market declines.

For more content like this, head to 5i Research or check out the below free 14-day trial.